Everything you need,
beautifully organized
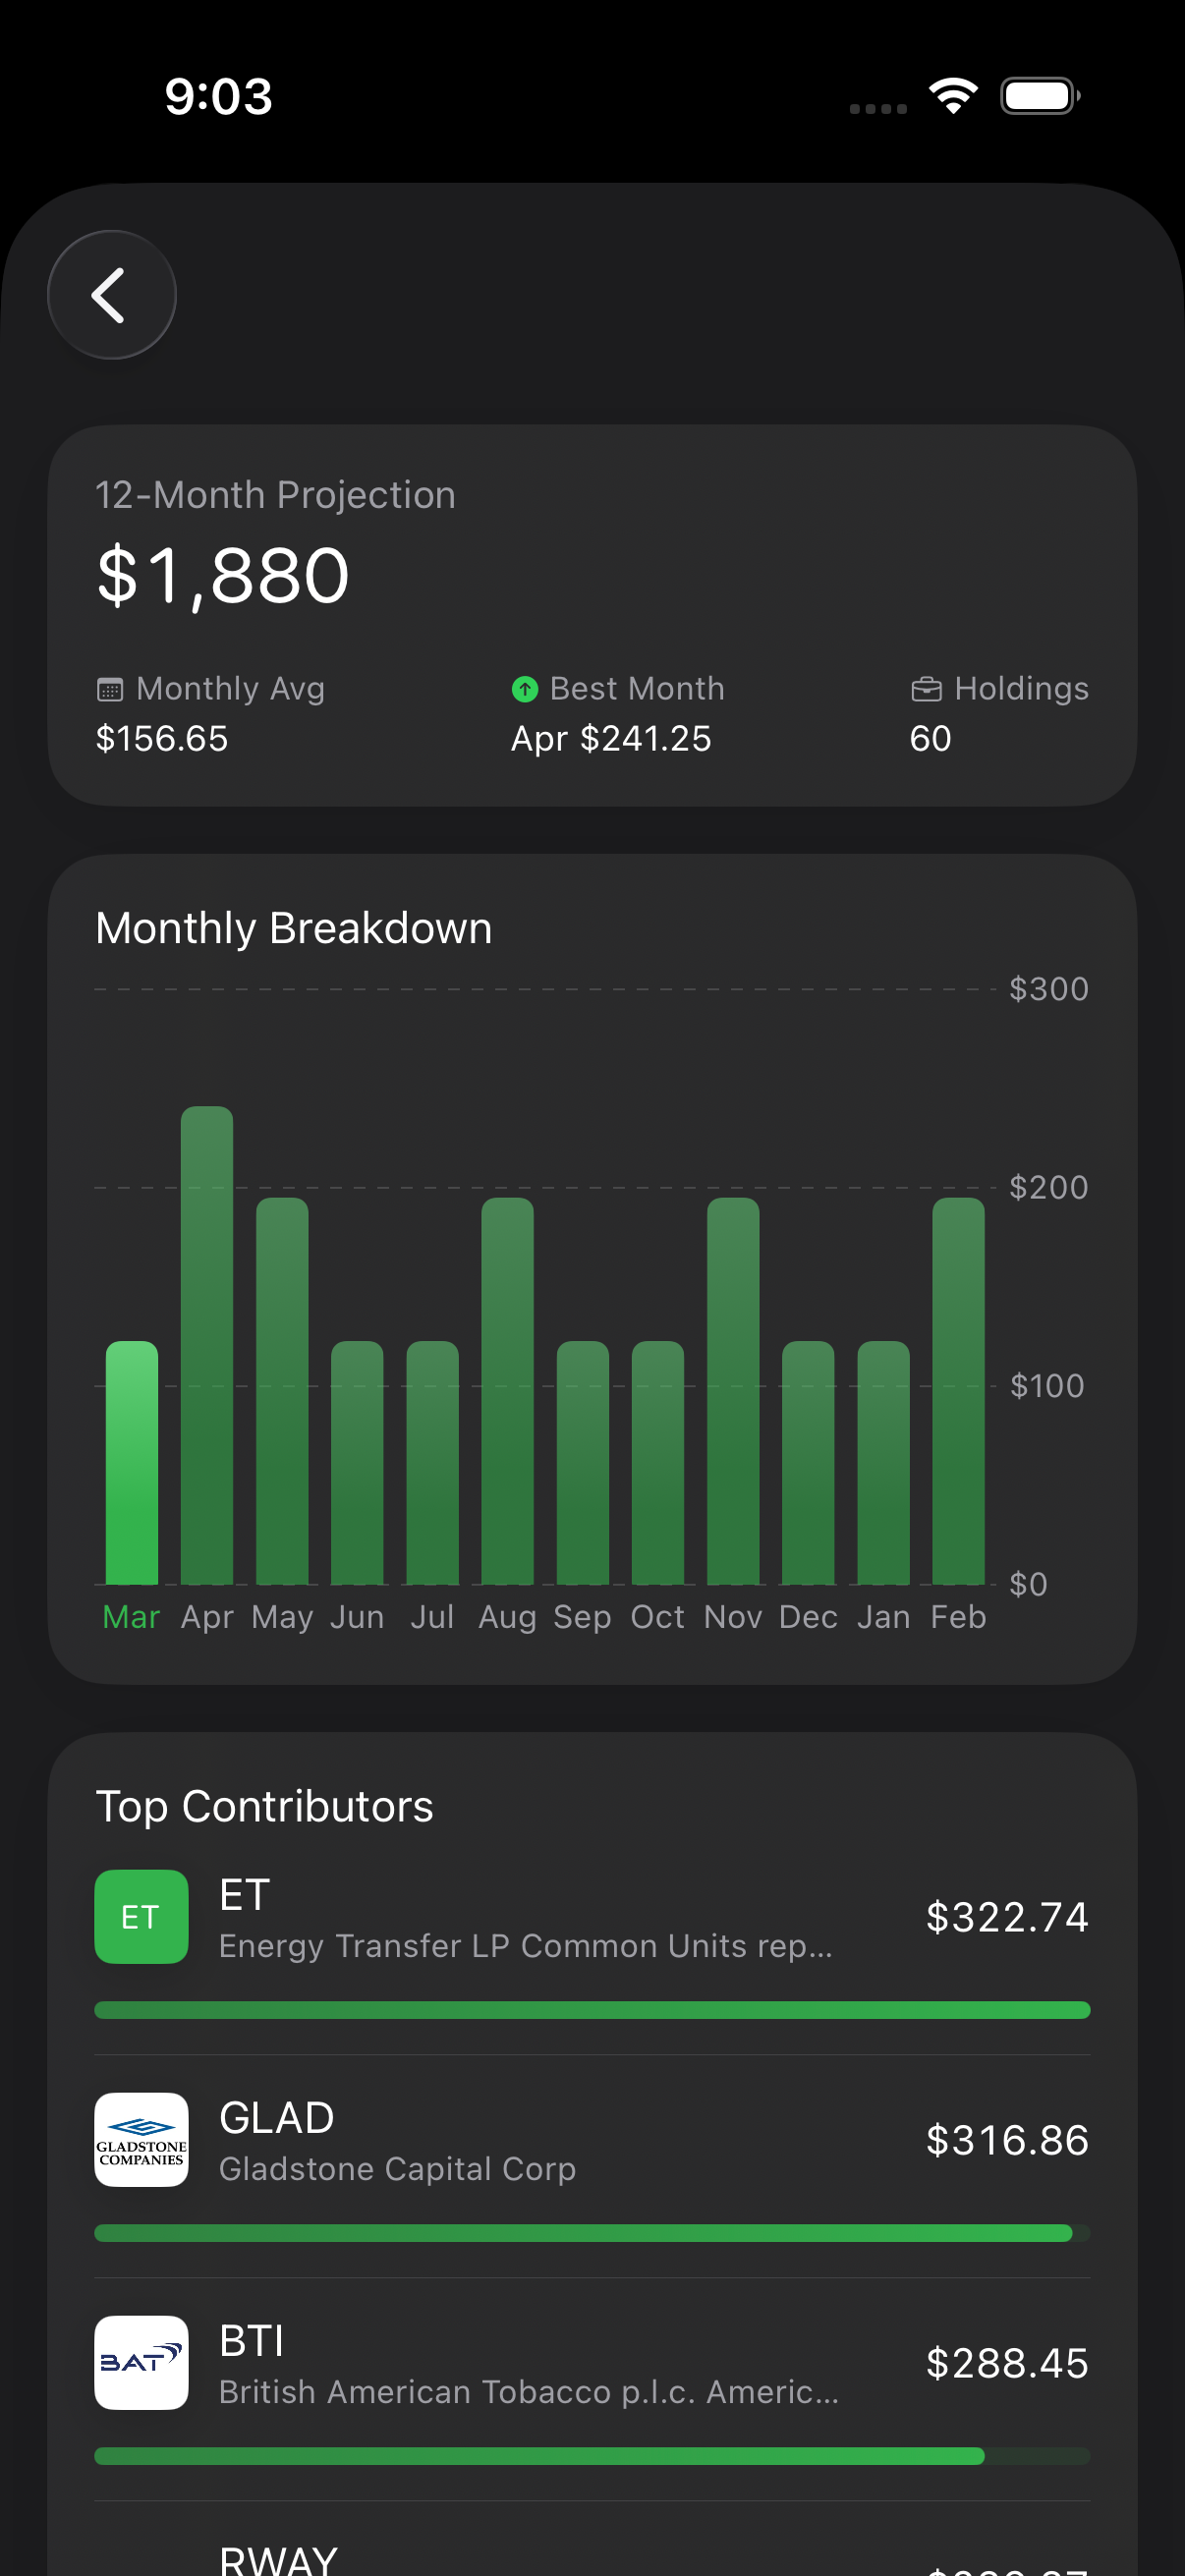
Income Forecast
See your projected dividend income for the next 12 months with a detailed bar chart. Identify your best-earning month, monthly average, and top contributors ranked by annual payout.
Dividend Calendar
Never miss an ex-date or pay date again. See every upcoming dividend on a monthly calendar with color-coded markers, market holidays, and total income per month.
DRIP Simulator
Model 1–30 years of dividend reinvestment with adjustable growth rates, contribution amounts, and tax brackets. Watch your income snowball with interactive area charts.
Sector Allocation
Interactive donut chart breaks down your holdings by sector. Get a diversification score out of 100 with top-sector concentration warnings and holding counts.
Stock Signals
Every holding scored 0–100 based on yield, payout safety, dividend growth, analyst consensus, and volatility. Filter by Strong Buy, Buy, or Hold in one tap.
See every feature in action
Explore the key screens that power your dividend strategy.
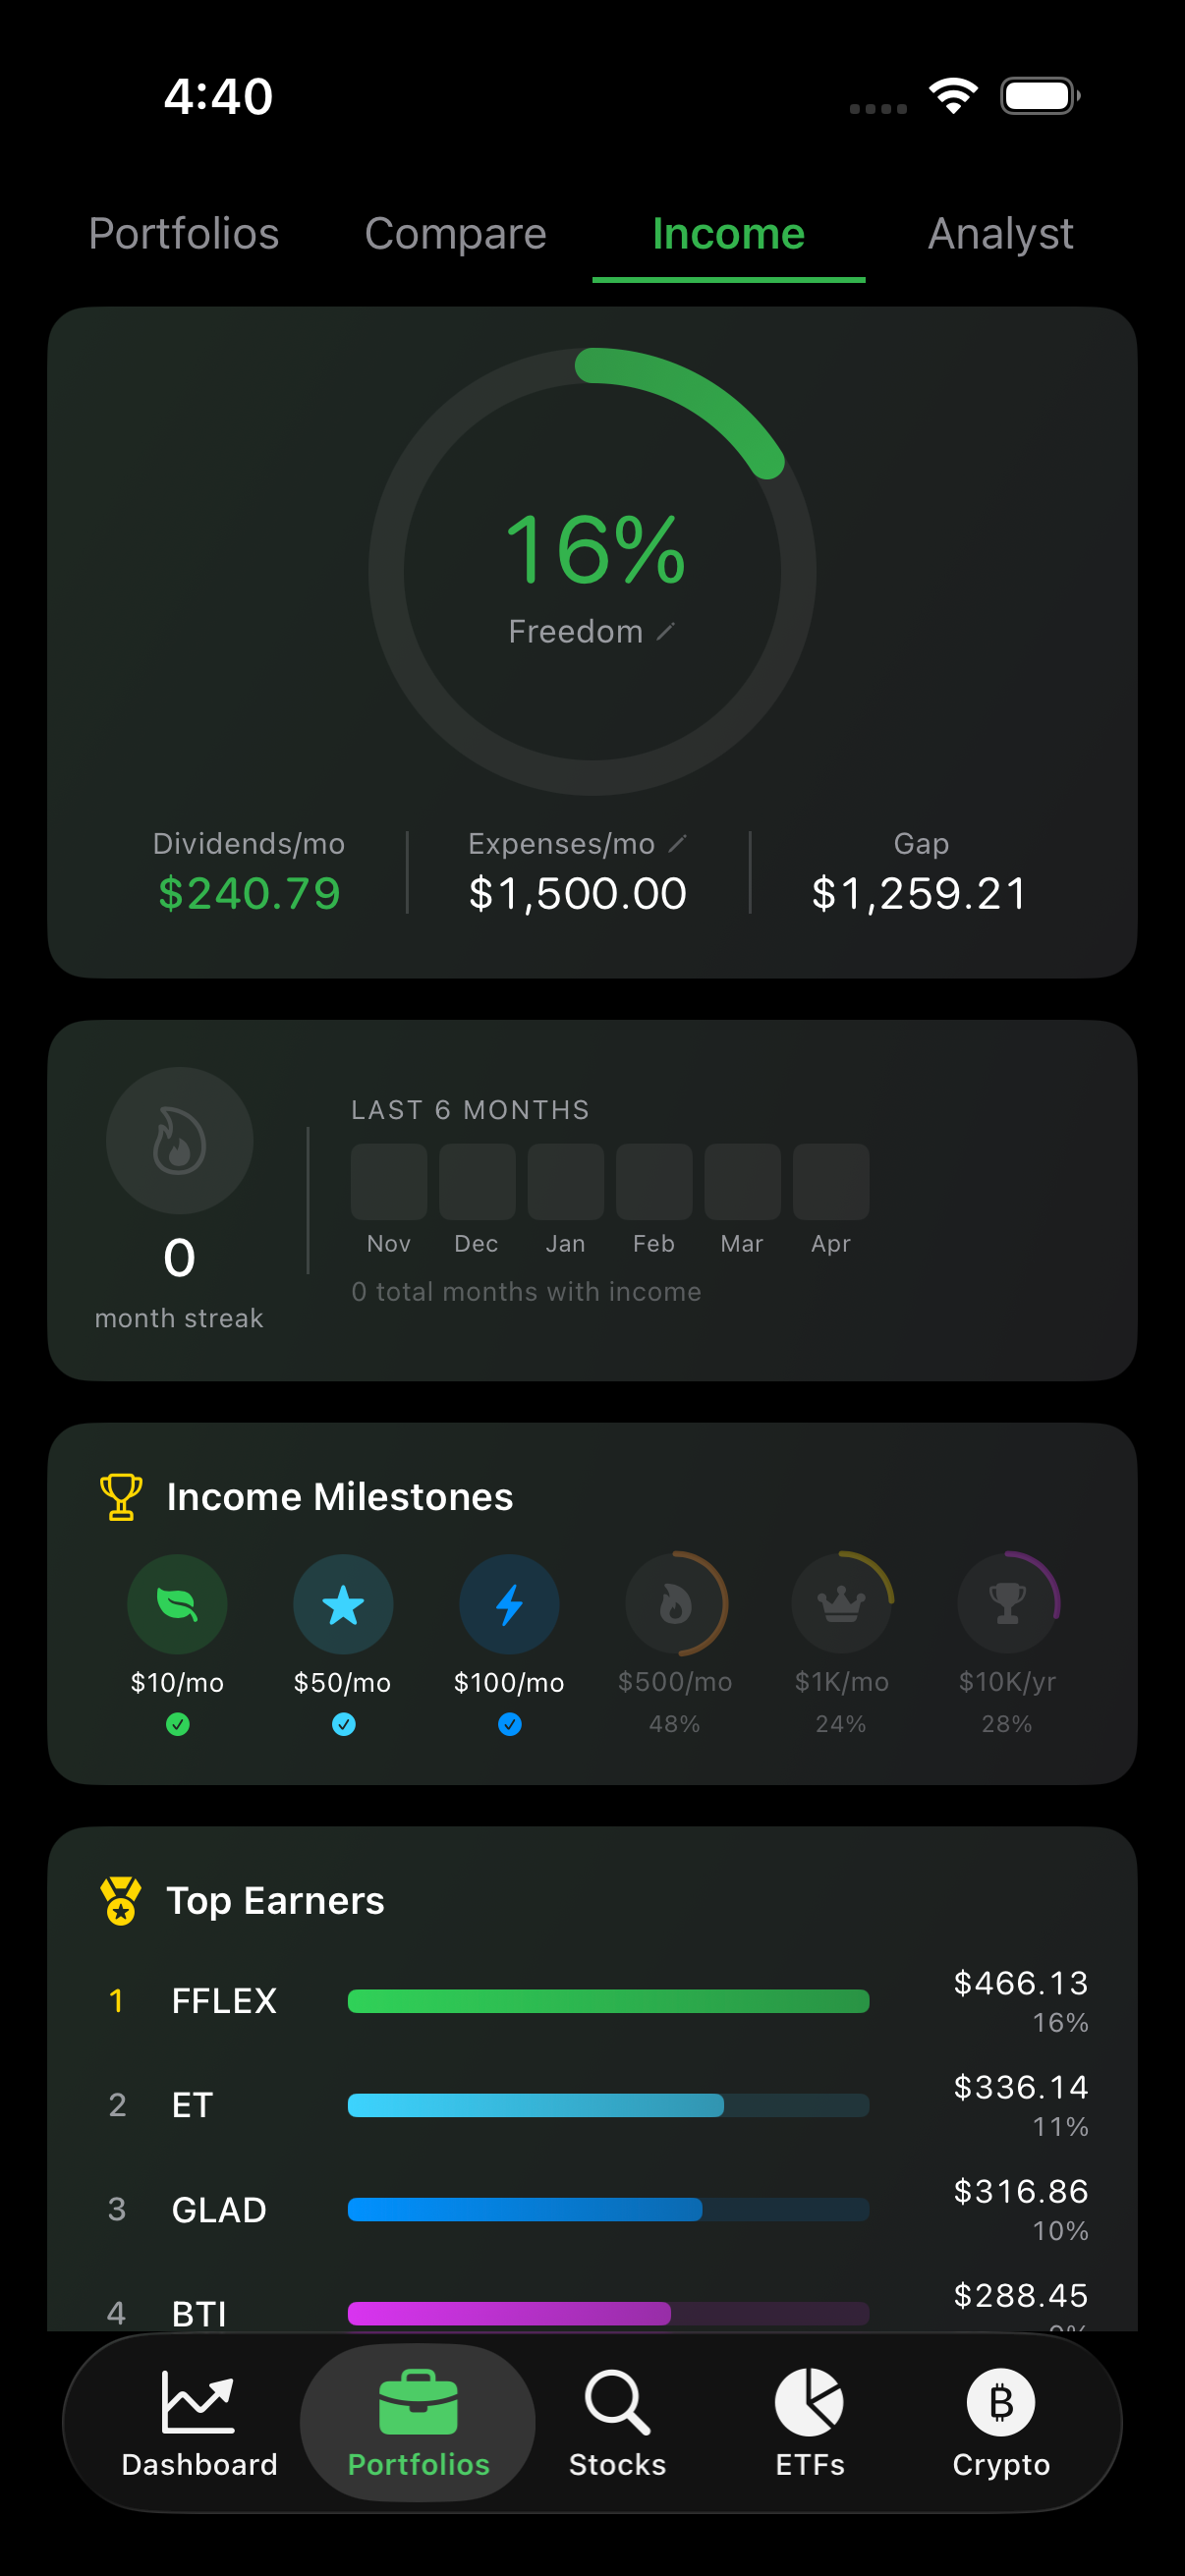
Income Freedom Score
See how close your dividend income is to covering your monthly expenses. A single percentage tells the story — with monthly income, expense gap, a 6-month streak tracker, income milestones from $10/mo to $10K/yr, and a ranked list of your top earners.
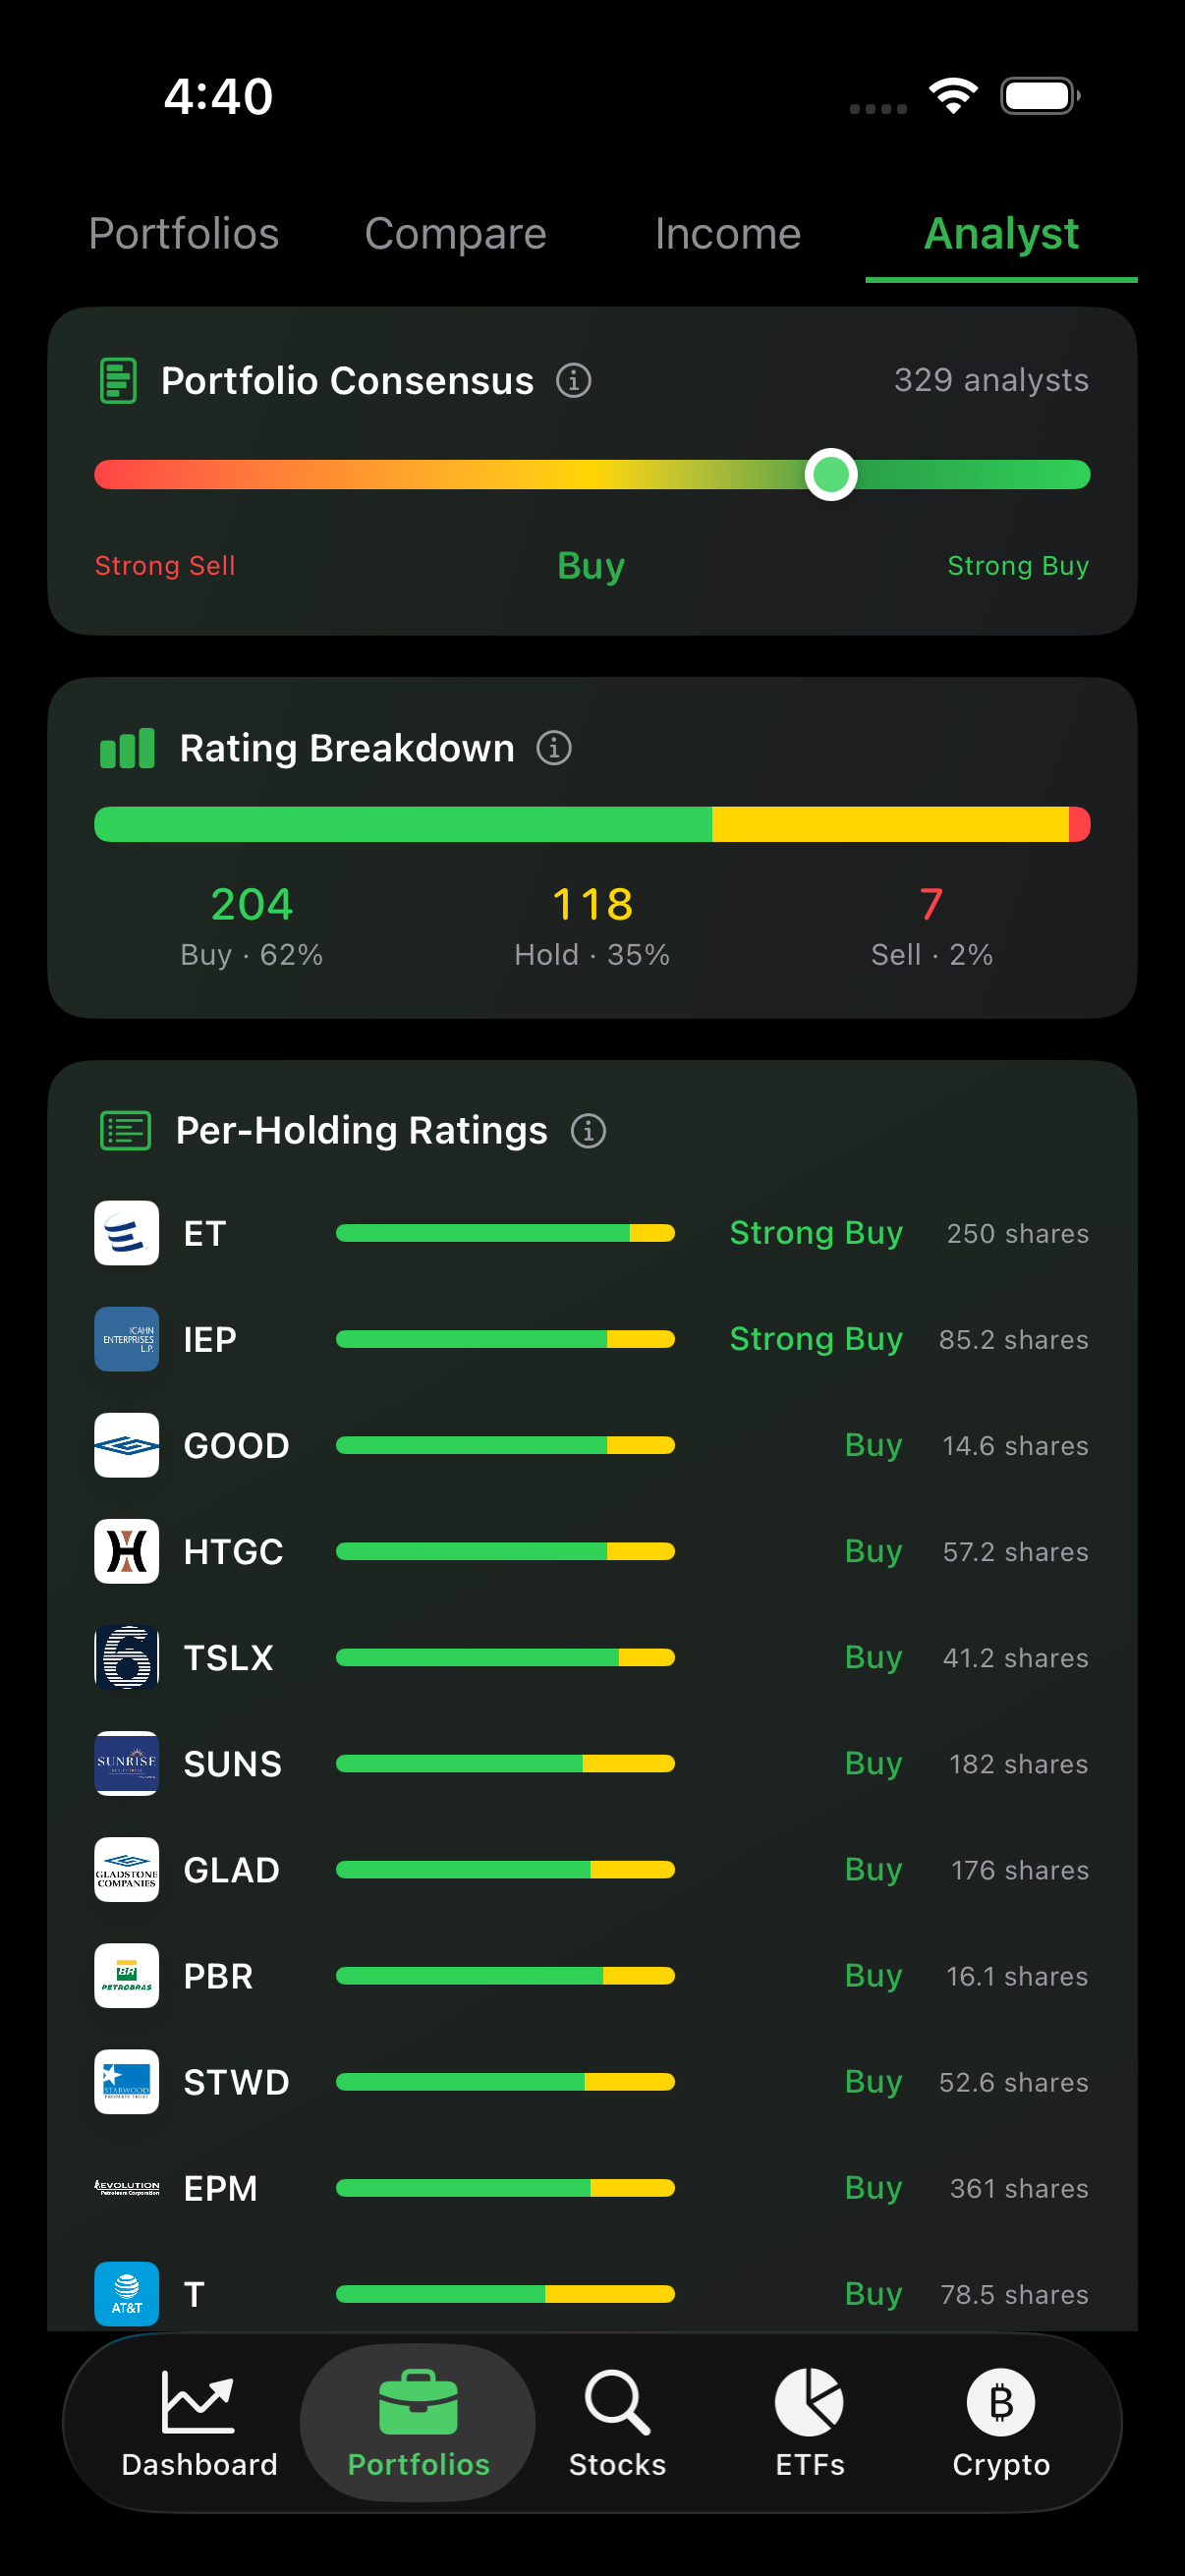
Analyst Consensus
Aggregate analyst ratings across your entire portfolio with a color-coded Buy/Hold/Sell breakdown and per-holding ratings.
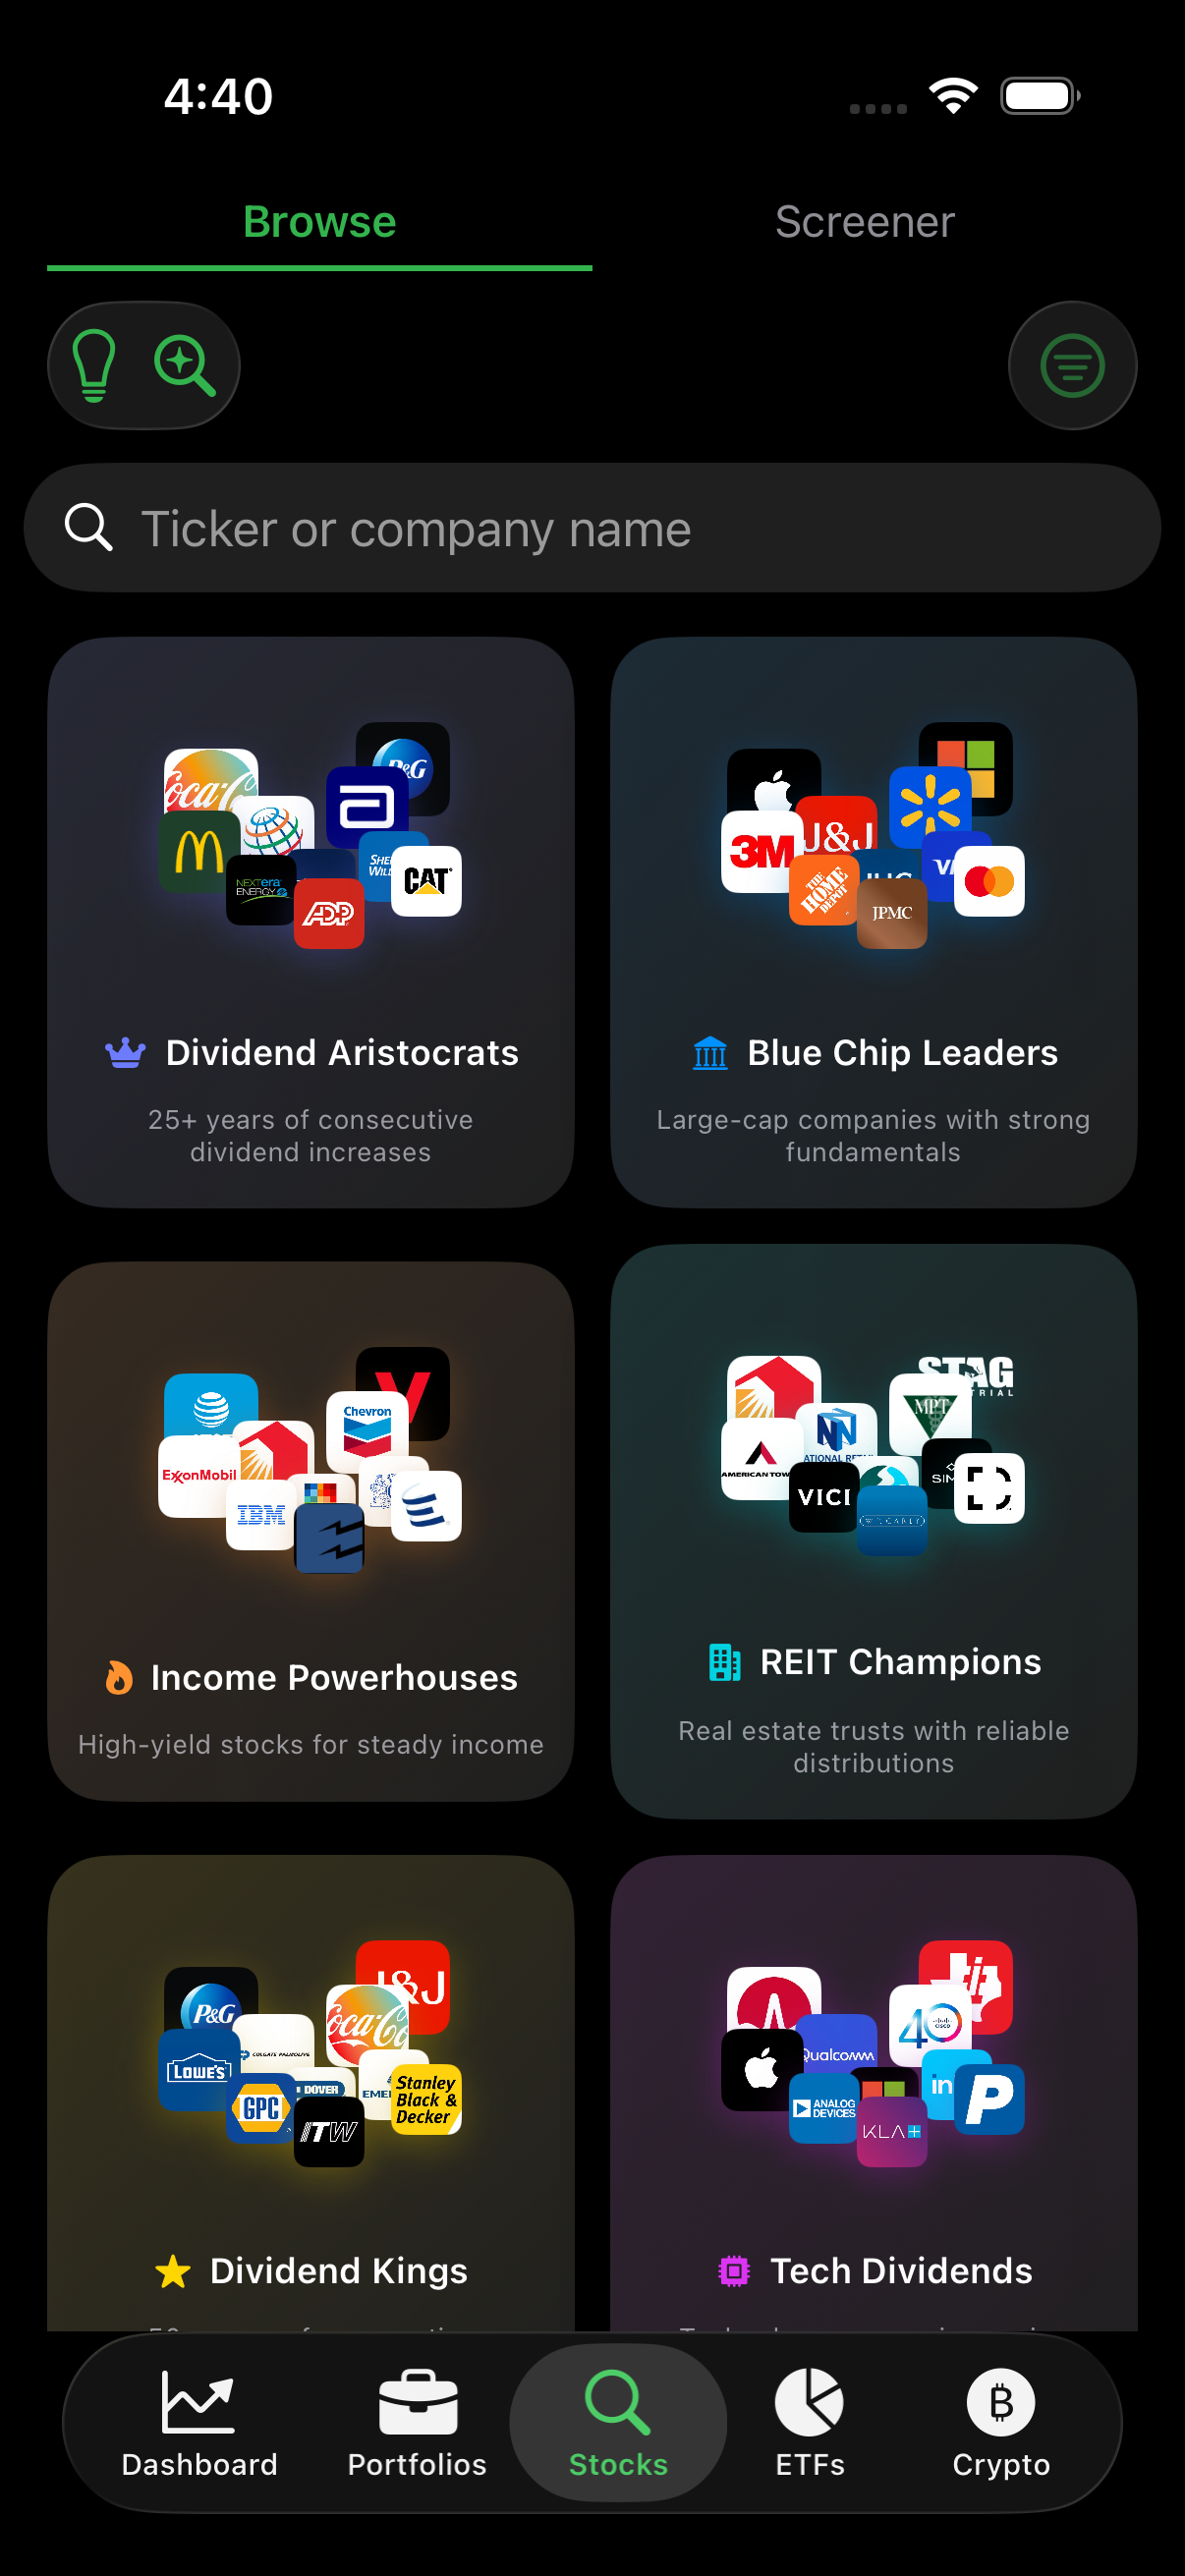
Stock & ETF Browser
Discover dividend stocks through curated collections — Aristocrats, Blue Chips, Income Powerhouses, REITs, and more.
Income Forecast
A 12-month projection of your dividend income with monthly bar charts, annual totals, and top contributors ranked by payout.
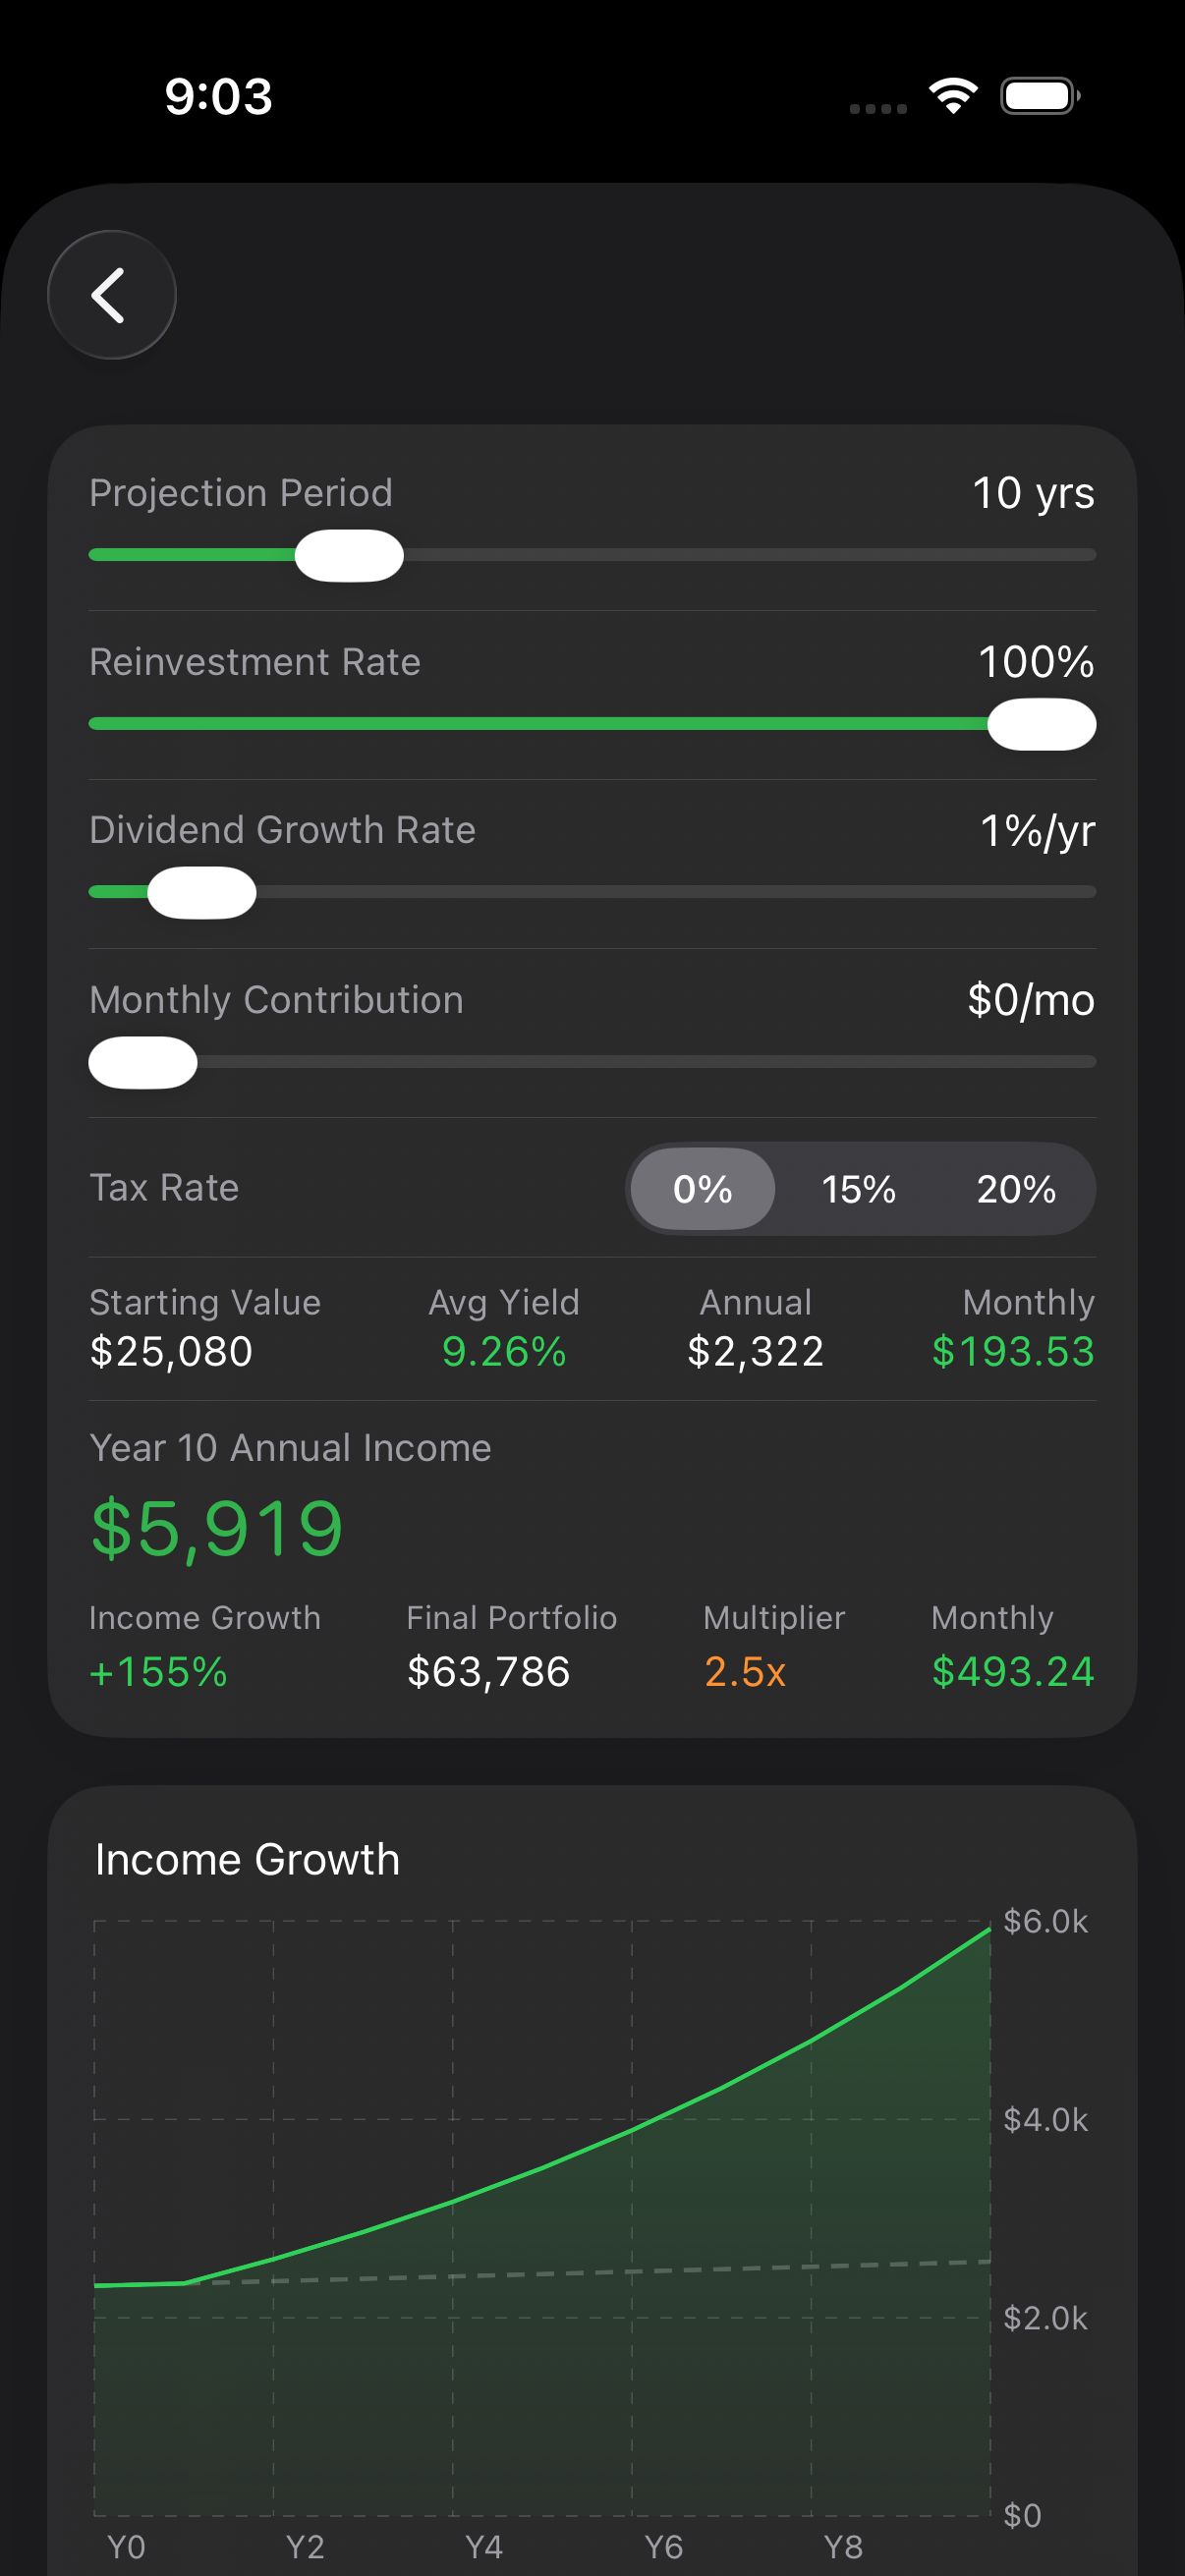
DRIP Simulator
Model compound growth over 1–30 years with adjustable reinvestment rate and dividend growth assumptions. An area chart compares DRIP vs non-DRIP trajectories.
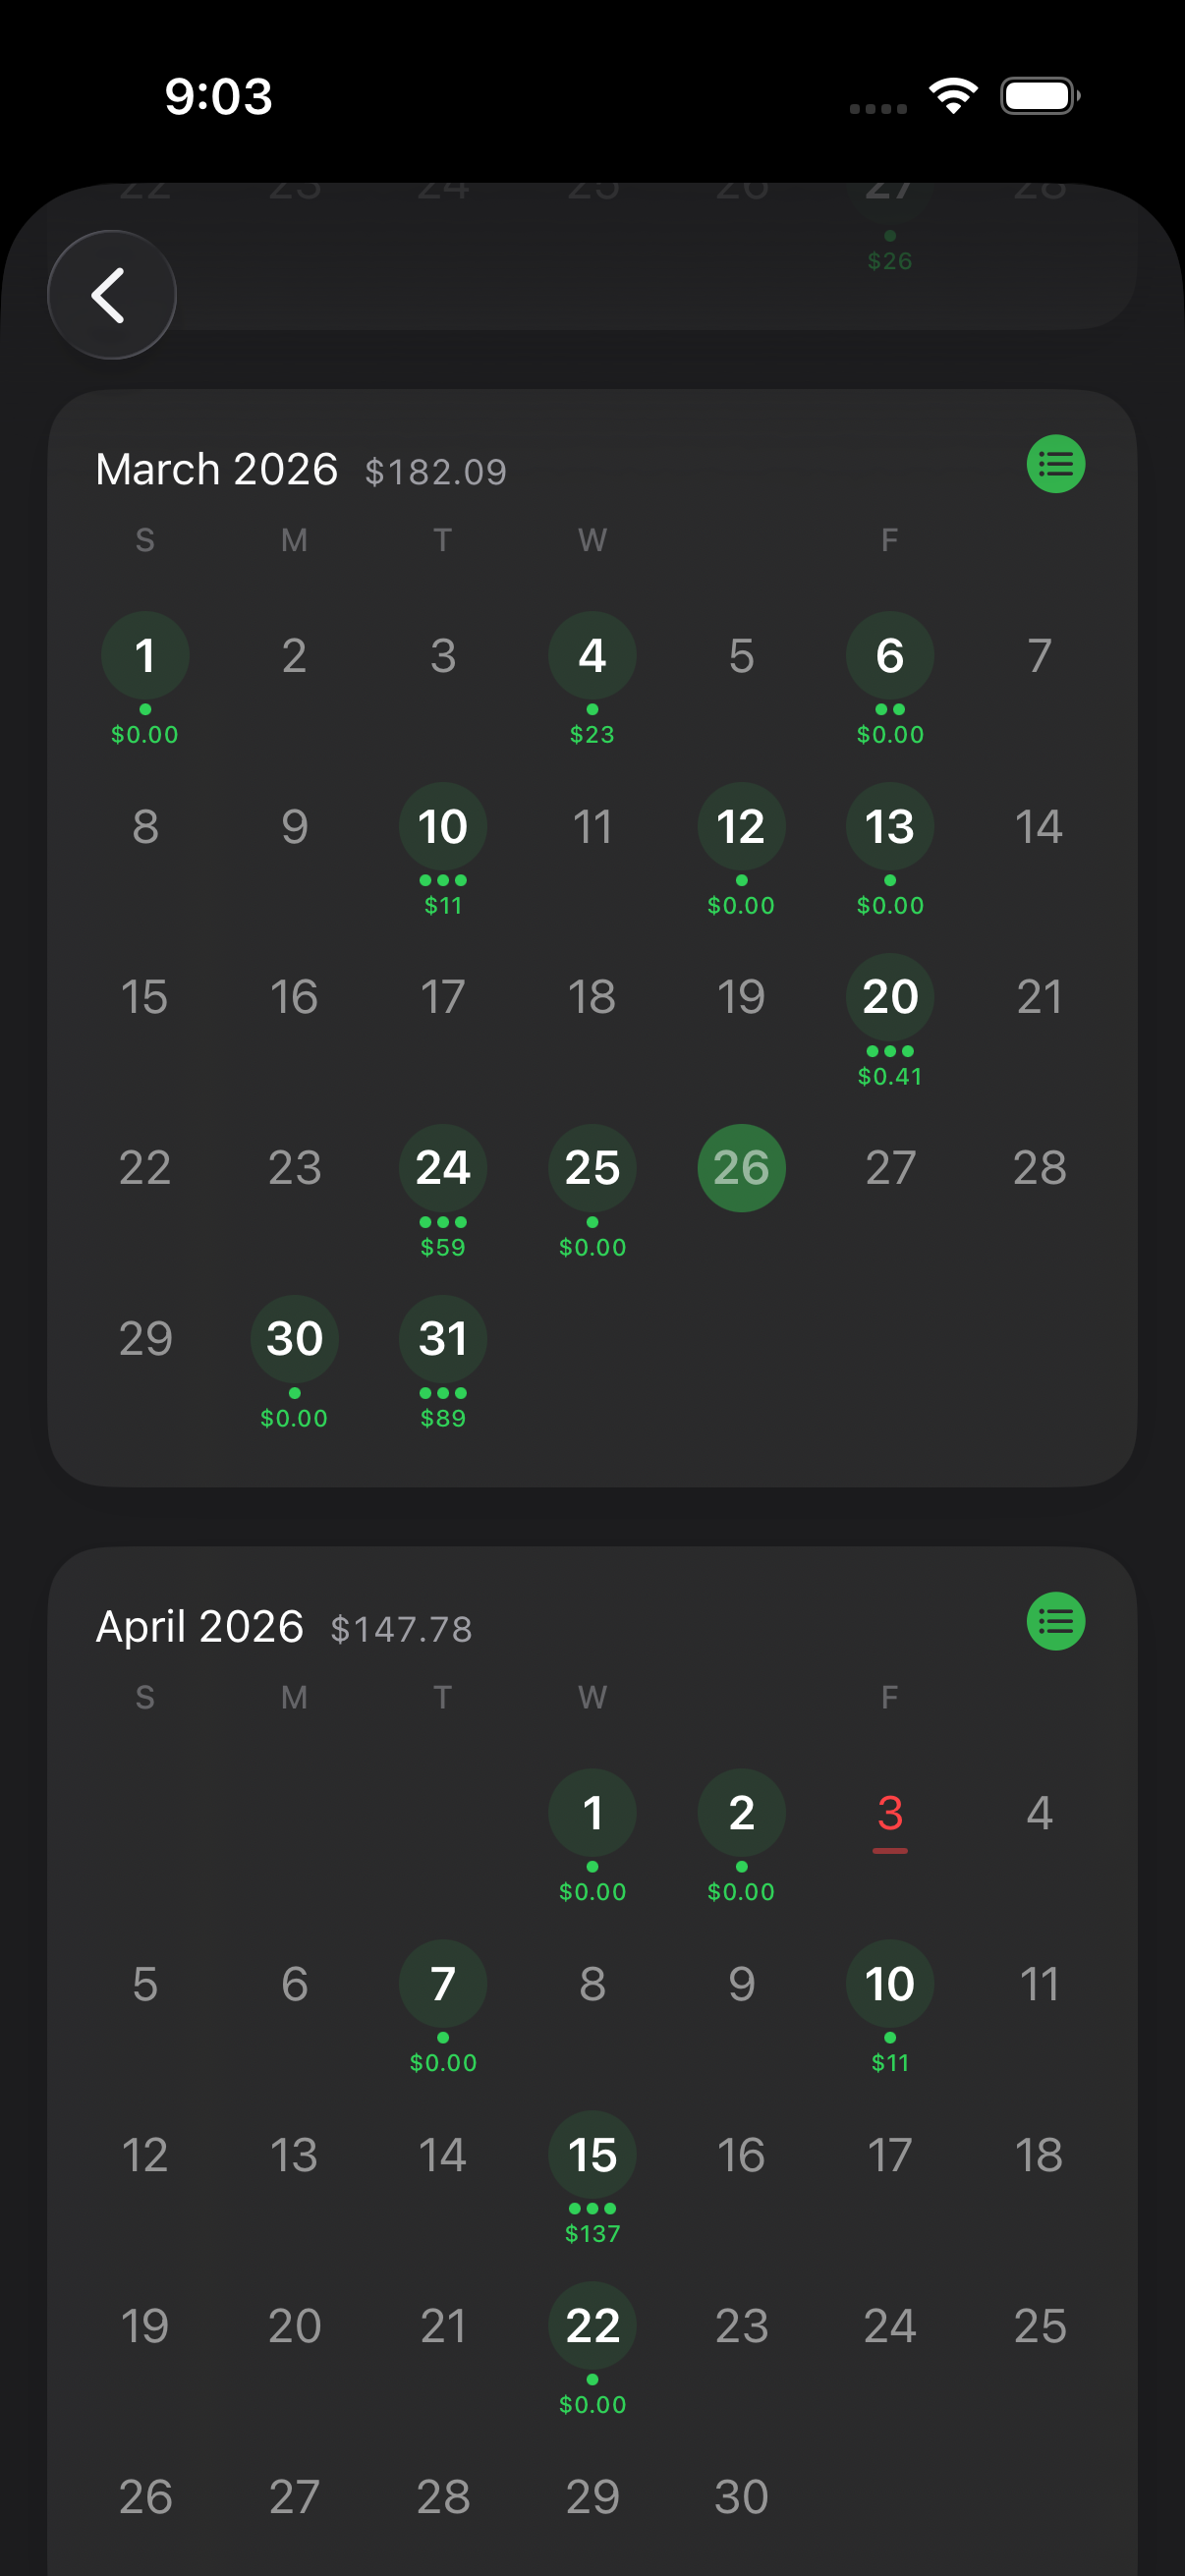
Dividend Calendar
Never miss a payment. Color-coded dots mark declared, estimated, and paid dividends on a monthly calendar with market holiday flags.
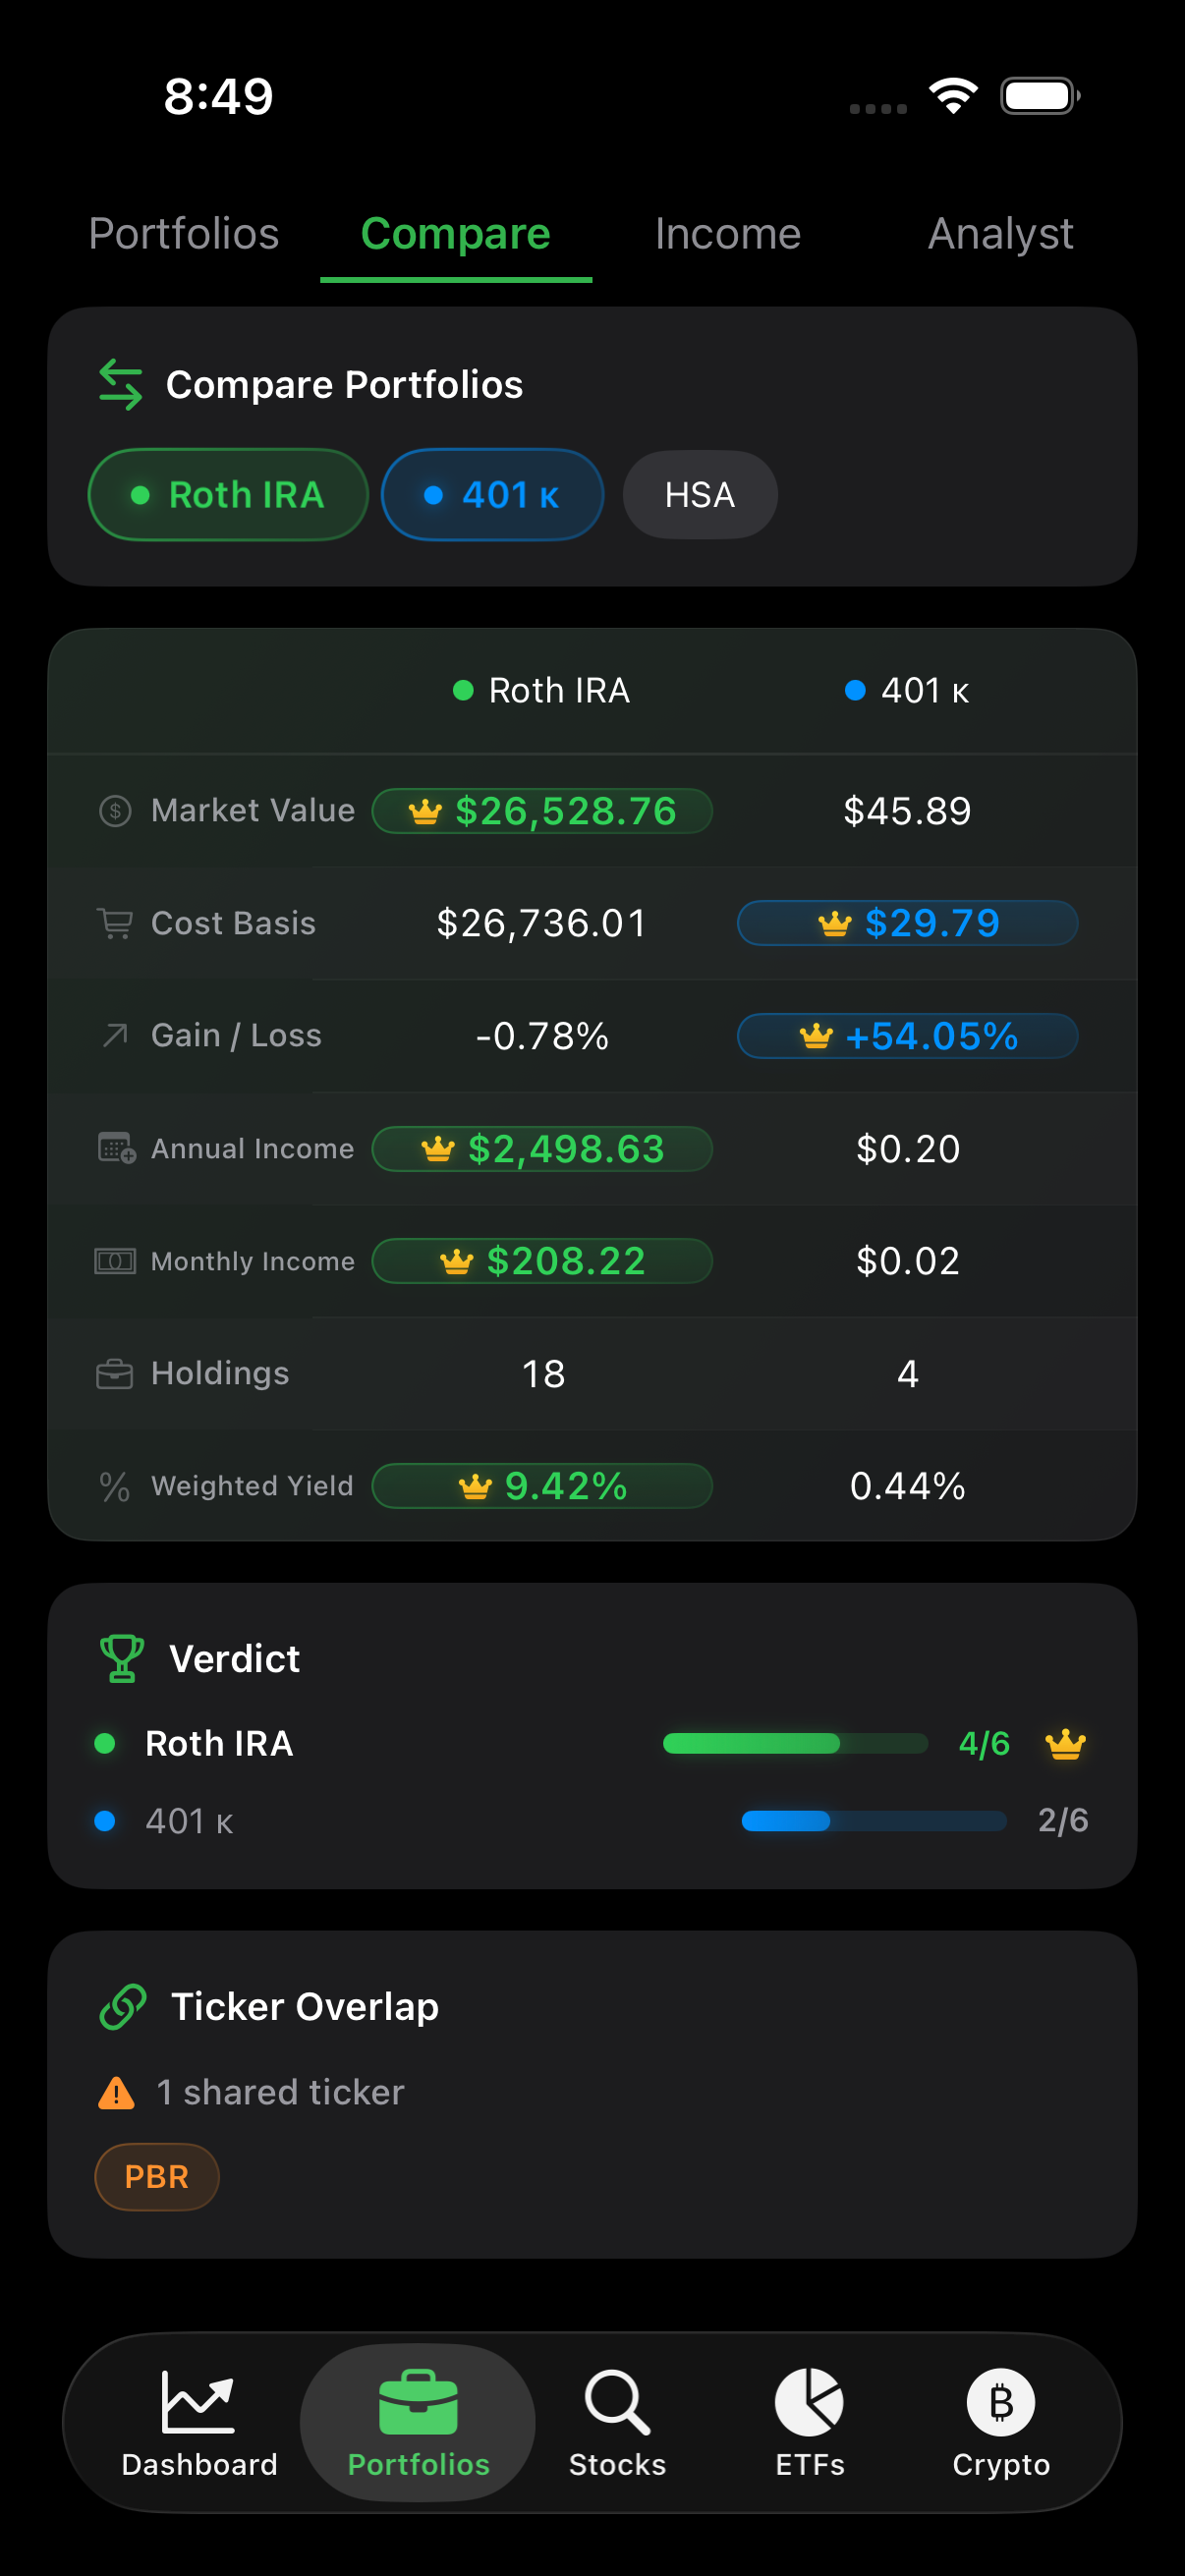
Portfolio Comparison
Pick any two portfolios and compare them side by side. Market value, cost basis, gain/loss, annual and monthly income, weighted yield, and holdings count — with crown icons highlighting the winner. A verdict scorecard tallies the results.
Built for serious
dividend investors
Privacy First
All portfolio data lives on your device — never uploaded to a server. No account creation, no email, no social login. Your holdings and financial data are yours alone.
Real-Time Data
Institutional-grade market APIs deliver live prices, dividend schedules, financials, split history, and analyst ratings. Data refreshes automatically with market-aware scheduling.
Smart Signals
A five-factor algorithm scores every holding: dividend yield, payout safety, dividend growth history, Wall Street consensus, and price volatility. Spot strong buys and risky holds instantly.
10+ Analysis Tools
Income forecast, DRIP simulator, sector allocation, dividend calendar, stock signals, tax summary, dividend safety, watchlist, news feed, and technical chart overlays — all built in.
Beautiful Dark UI
A native iOS app built with SwiftUI for buttery-smooth animations, instant navigation, and a dark theme designed for investors who check their portfolio at any hour.
No Bloat
Zero ads, zero tracking pixels, zero unnecessary permissions. Divvy does one thing — track dividend income — and does it exceptionally well. Fast launch, small footprint.
Up and running in minutes
Three simple steps to take control of your dividend income.
Download Divvy
Available on the App Store for iPhone. No account creation, no email, no sign-up forms. Open the app and you're ready to go in seconds.
Add Your Holdings
Search for any stock, ETF, or crypto by name or ticker. Enter your shares and cost basis — Divvy automatically fetches live prices, dividend schedules, financials, and company details.
Track & Grow
Your dashboard lights up with income forecasts, calendar dates, signal scores, sector breakdowns, and DRIP projections. Monitor your portfolio's dividend health in real time as markets move.
Five tabs. One dashboard.
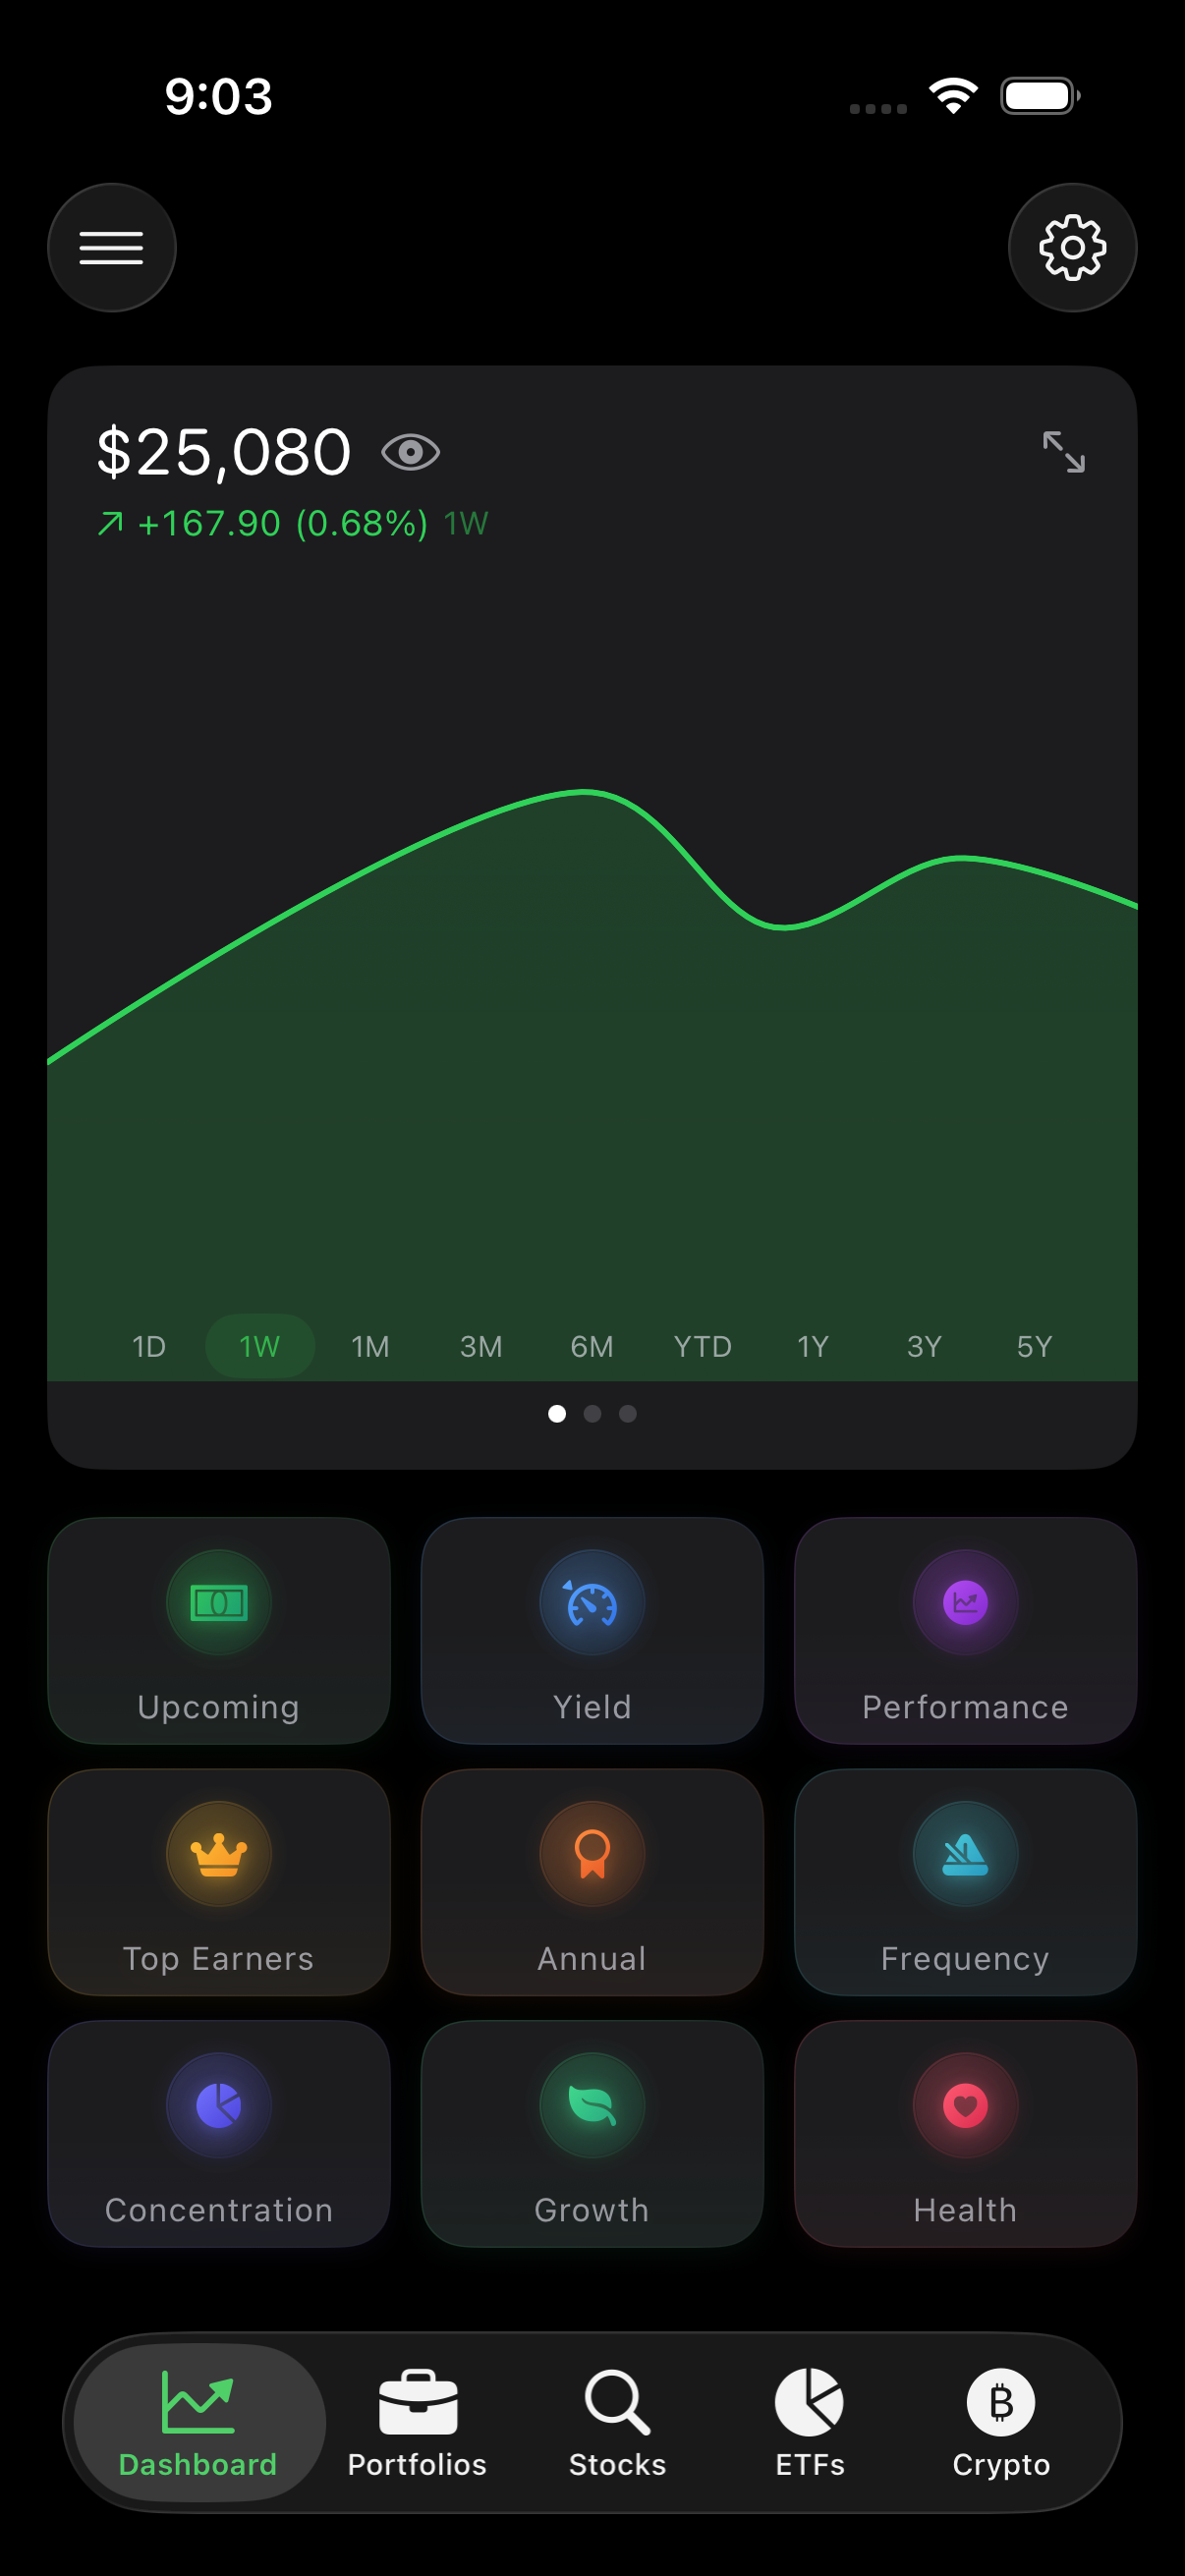
Your command center. Portfolio value with interactive charts, a 9-tile grid linking to every analysis tool — from income forecast to dividend safety.
Track how close your dividends are to covering expenses. Freedom score, milestones, streak tracker, and top earners — all in one view.
Discover dividend stocks through curated collections — Aristocrats, Blue Chips, Income Powerhouses, REITs, and more. Search by name or ticker.
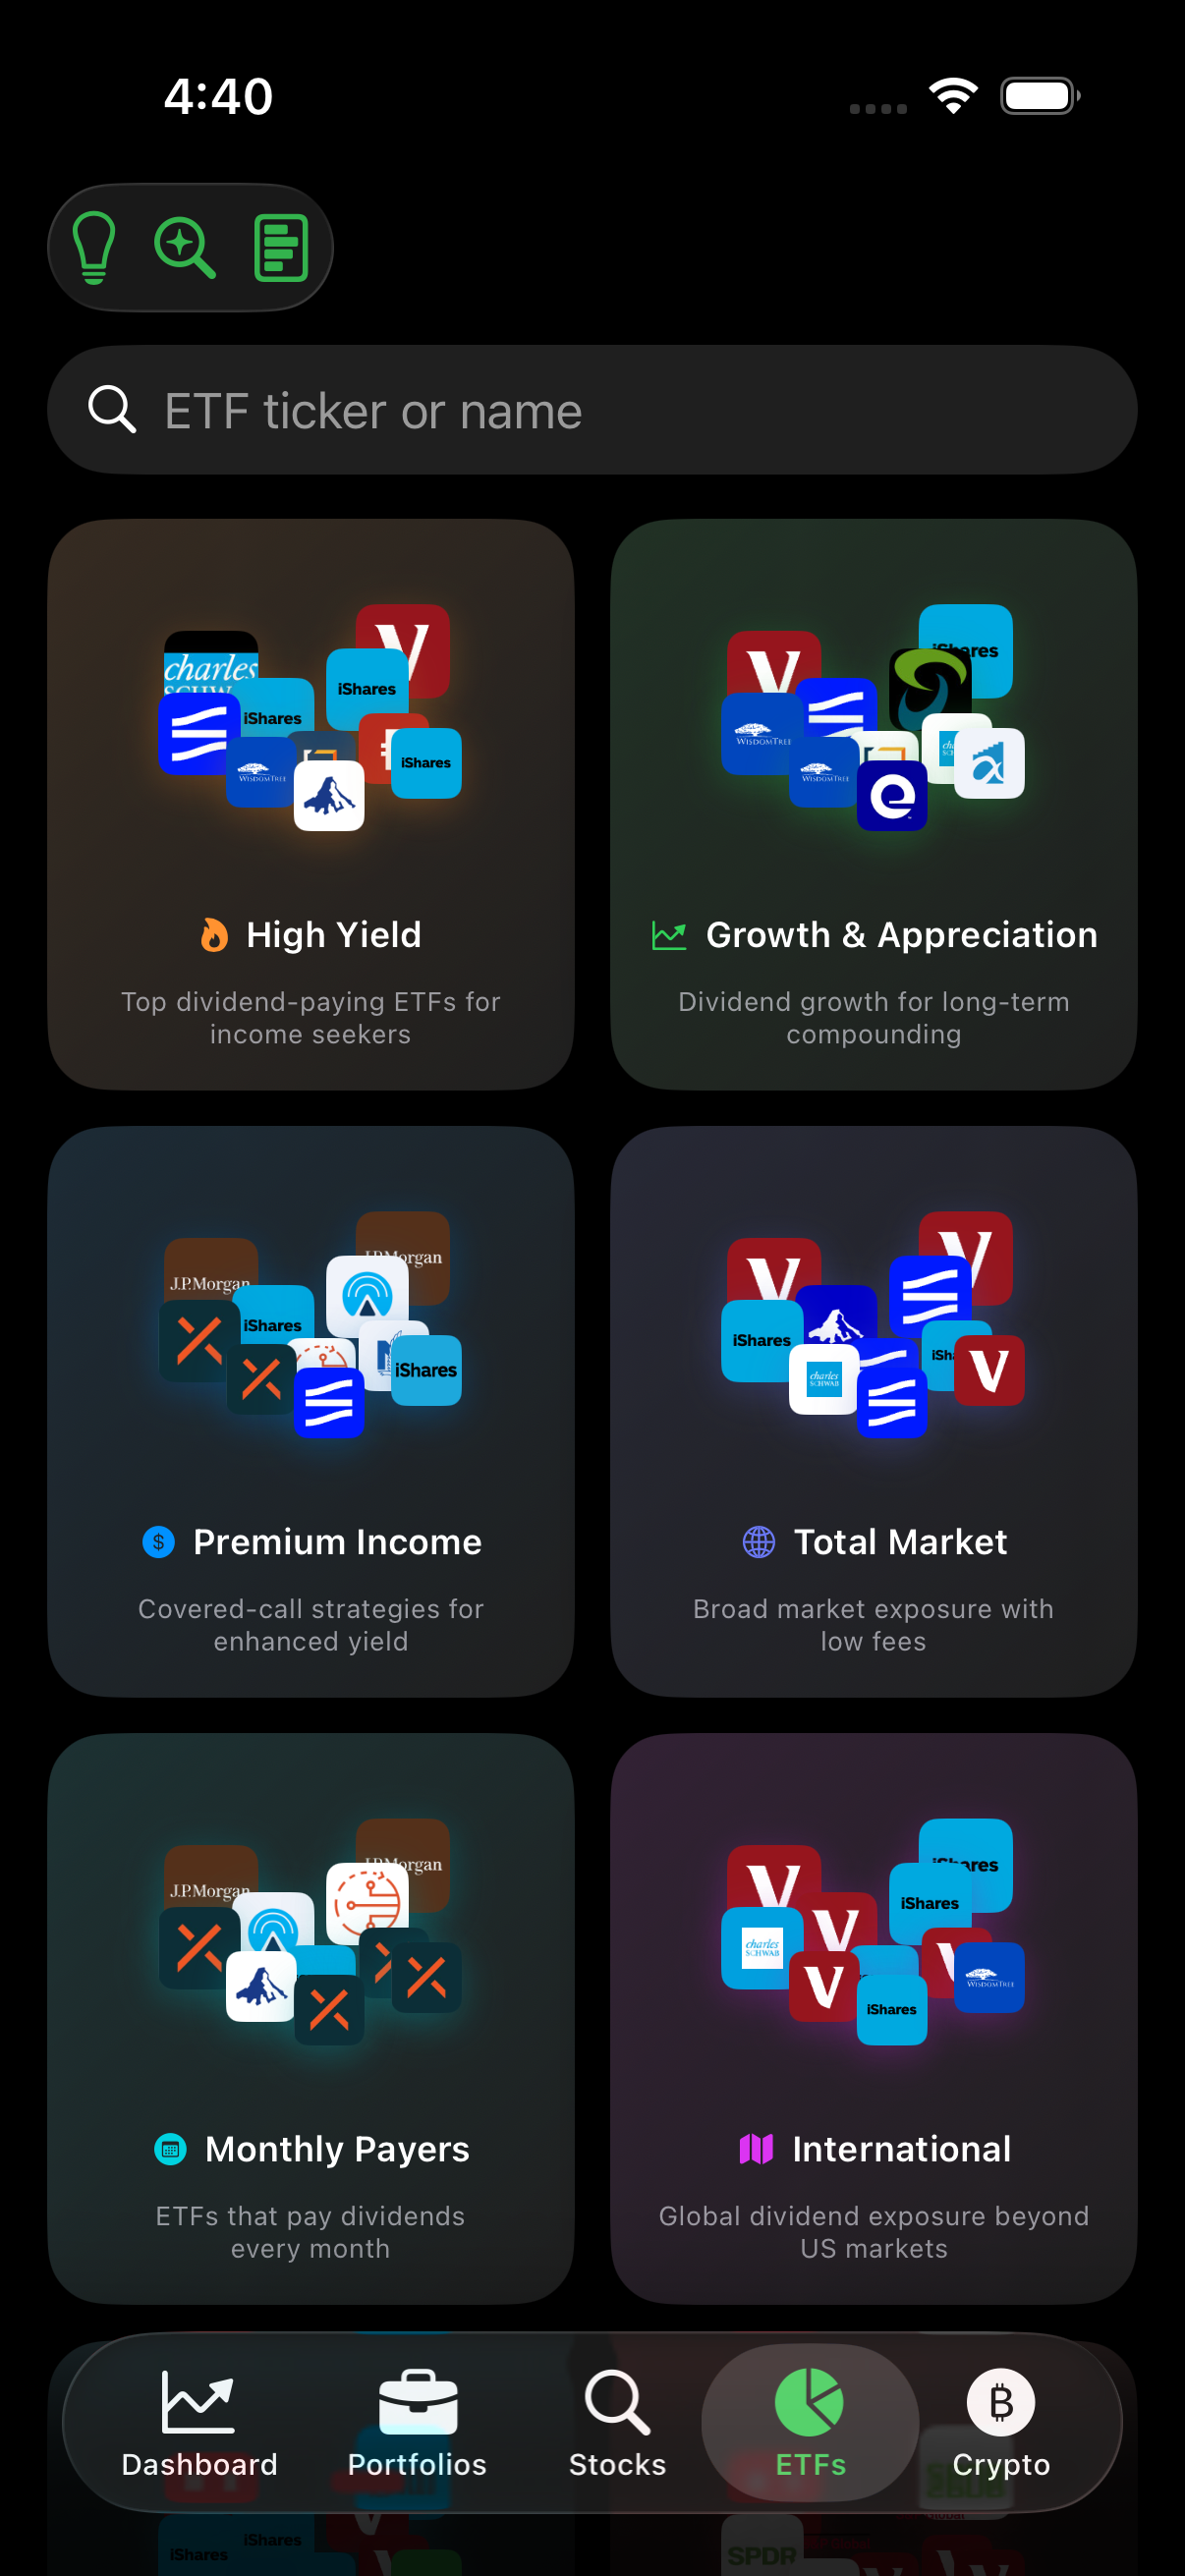
Browse dividend ETFs by category — High Yield, Growth, Premium Income, Monthly Payers, and International. Full detail pages with charts and data.
Never miss a payment. Color-coded calendar with ex-dates, pay dates, and monthly income totals. Market holidays flagged for settlement delays.